This tutorial has been adapted by Tierney Steelberg, Digital Liberal Arts Specialist at Grinnell College. This tutorial was originally written by Katherine Walden, former Digital Liberal Arts Specialist at Grinnell College. Tutorial instructions were co-authored by Sarah Purcell (L.F. Parker Professor of History, Grinnell College) and Papa Ampim-Darko, a student research assistant at Grinnell College.
This tutorial was reviewed by Gina Donovan (Instructional Technologist, Grinnell College).
This tutorial is adapted from Doing Digital History’s Voyant tutorial.
 This work is licensed under a Creative Commons Attribution-NonCommercial-ShareAlike 4.0 International License.
Voyant Tools is an open-source web application developed by Stéfan Sinclair and Geoffrey Rockwell in 2003, with later contributions added by Andrew MacDonald, Cyril Briquet, Lisa Goddard, and Mark Turcato. While Voyant is one of the leading robust web-based textual analysis interfaces, it grew out of existing text analysis tools like HyperPo, Tapoware, and TACT. Voyant also offers open-source code that can be used to deploy the program on a server. Voyant users can upload text files from their computer, link to online text sources, or scrape the text off a webpage for analysis and visualization. Unlike more advanced, programming-oriented textual analysis programs like R and R Studio, Voyant gives users access to a range statistical analysis and visualization features without requiring significant technical knowledge.
Table of Contents
- Uploading Data
- Editing in Voyant
- Voyant’s Tools
- Interacting with Voyant Tools
- Exporting from Voyant
- Building Your Own Corpus
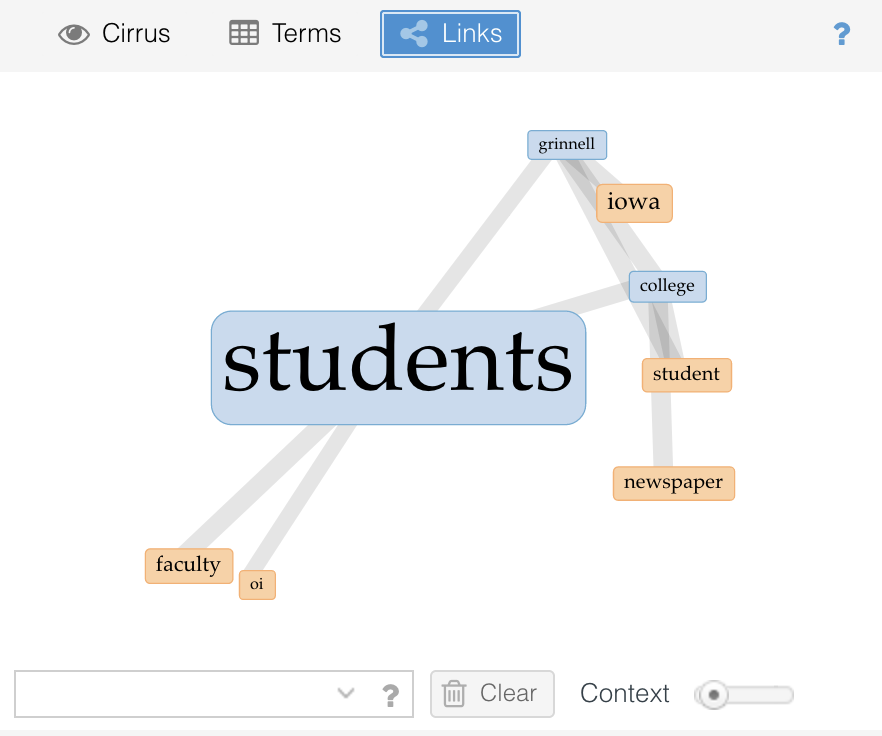
- Get Help
Uploading Data
1-Navigate to https://teaching.steelberg.sites.grinnell.edu/wp-content/uploads/2022/09/SandBText1965-1969-aspell.zip in a web browser and save the “SandBText1965-1969” compressed zip folder to your desktop. (Make sure it stays a compressed .zip file – some browsers automatically try to extract .zip files for you.)
2-Open a web browser (preferably Firefox or Chrome) and navigate to Grinnell’s cloud hosted instance of Voyant at https://dlac-voyant.us.reclaim.cloud
Note: there is also an open, public version of Voyant available – we are simply using our own hosted instance so as not to have to worry about bandwidth or runtime issues.
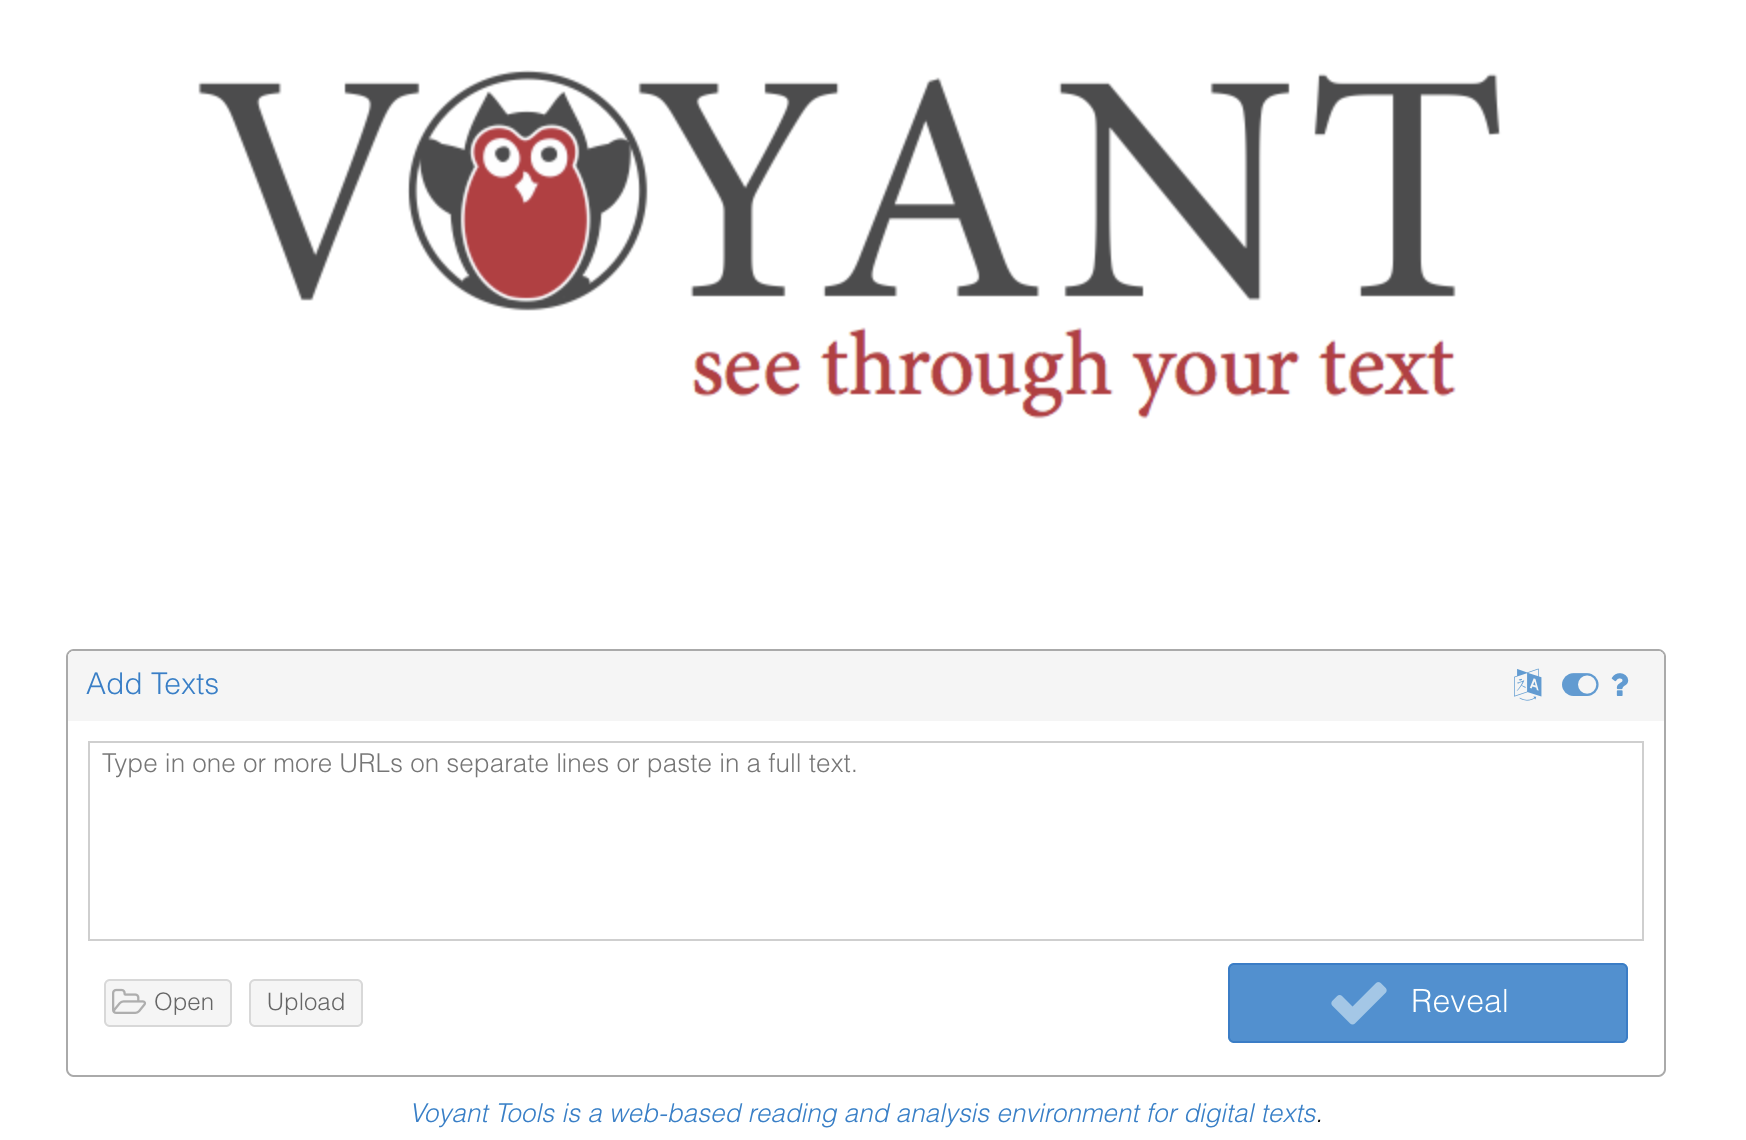
3-Upload the zip folder and click Reveal.
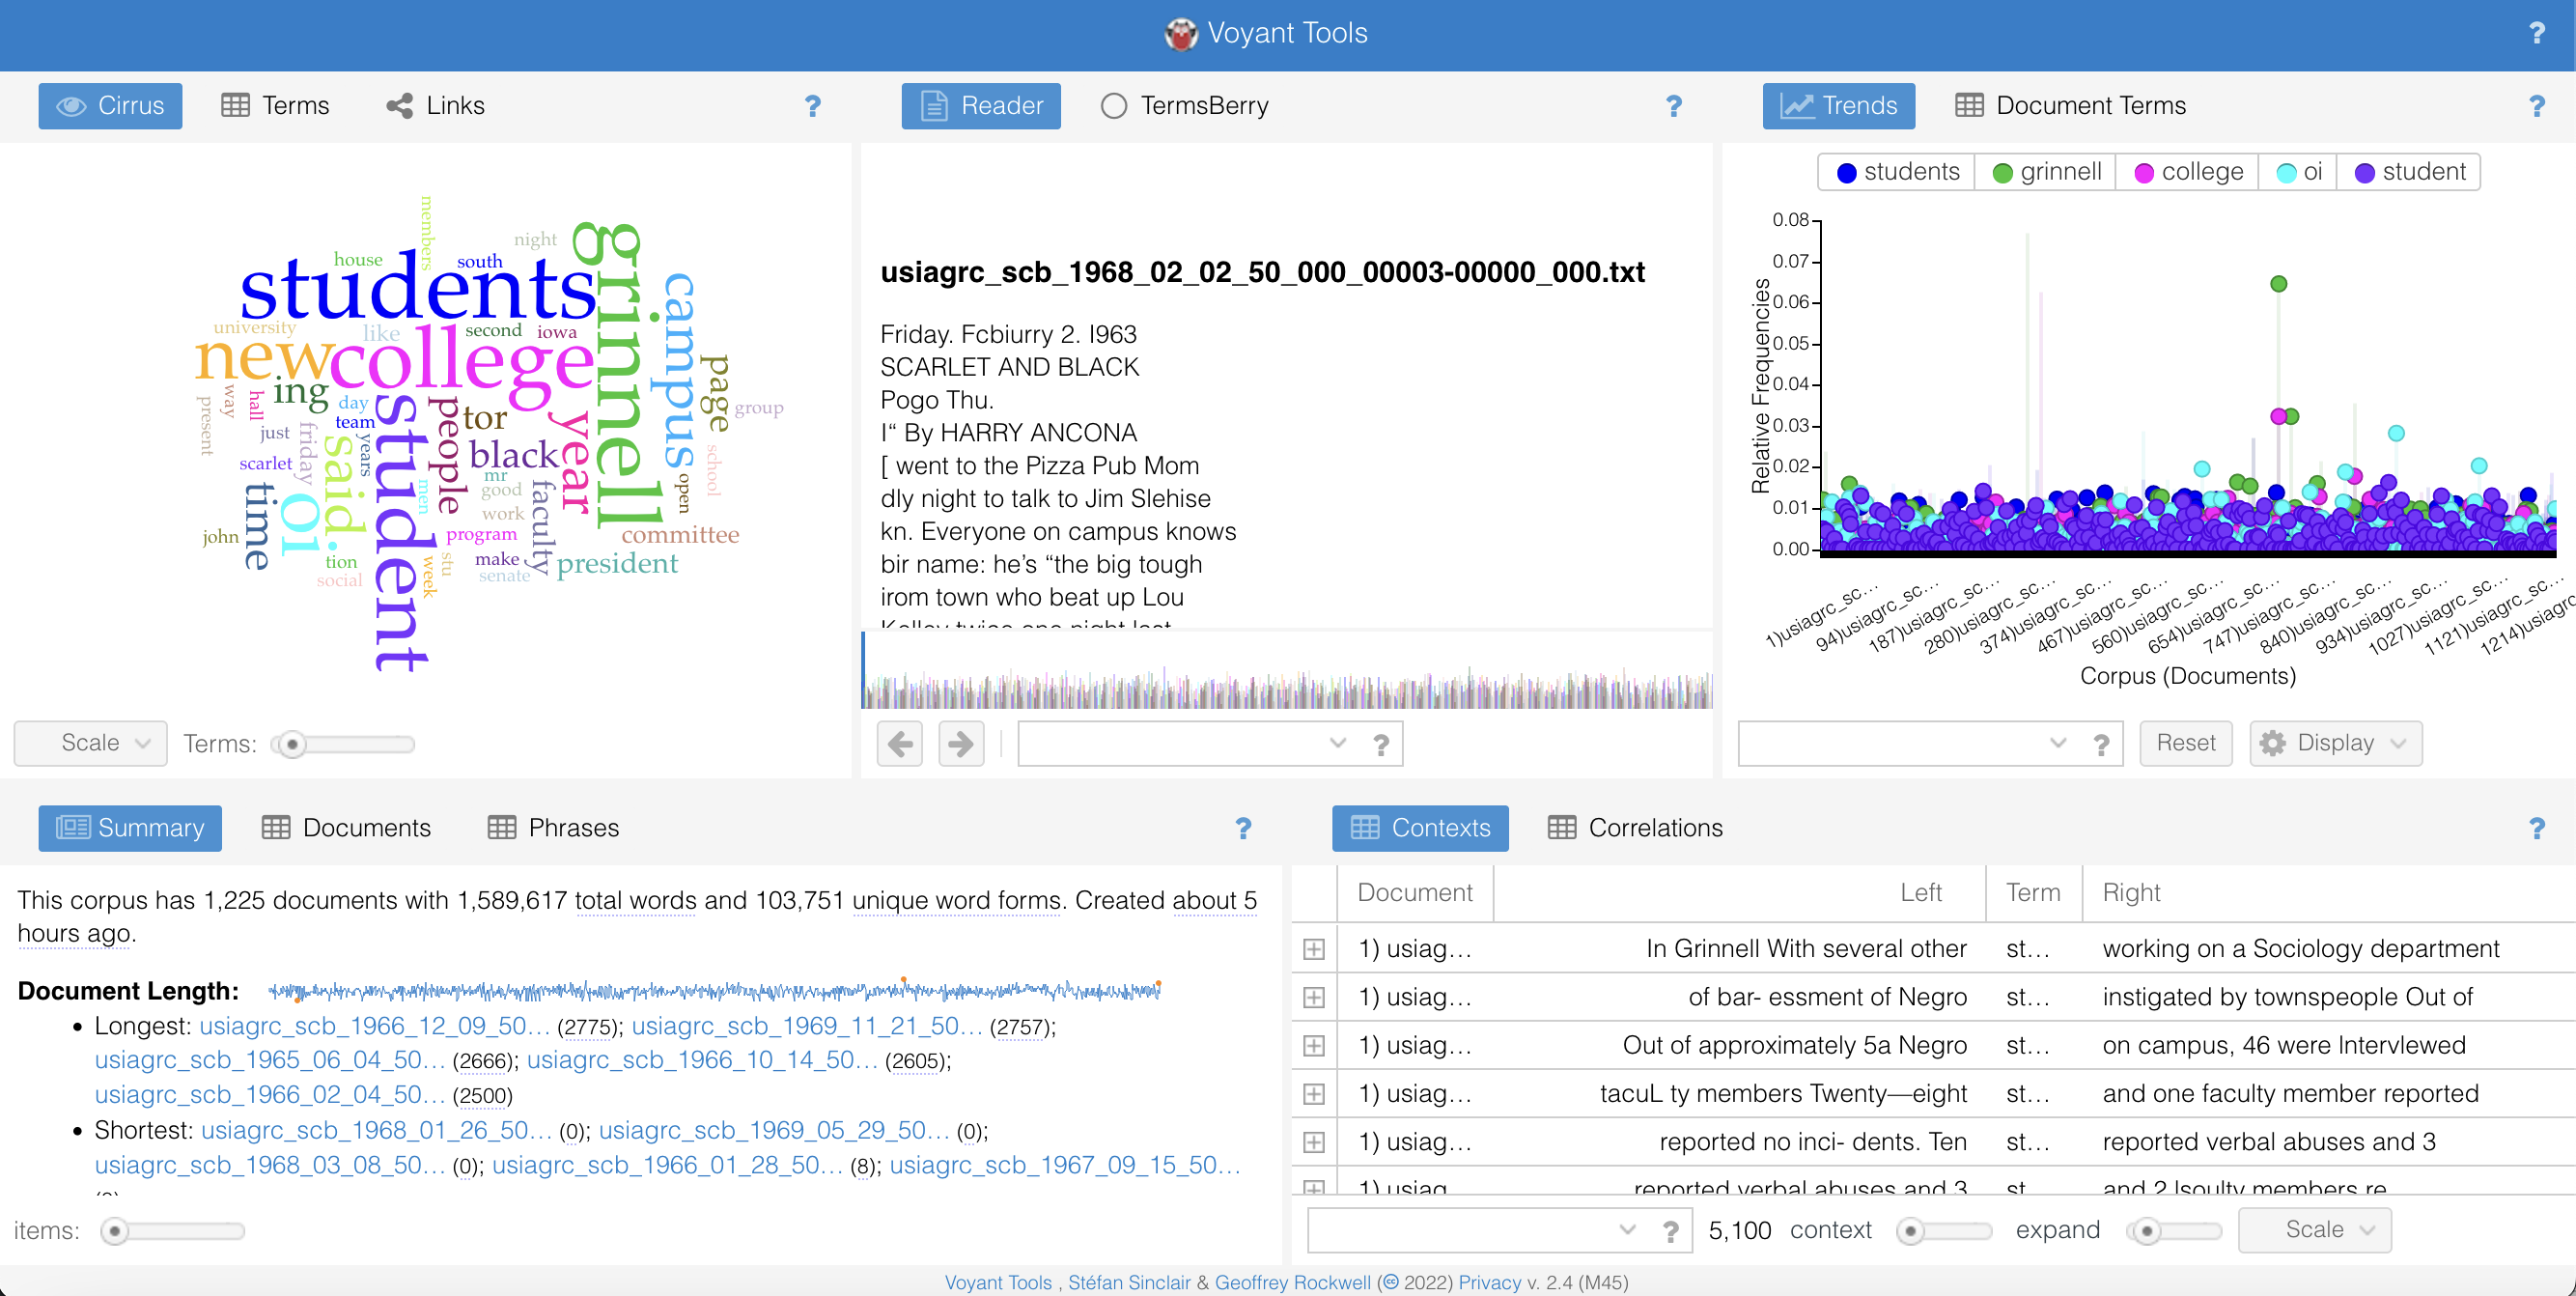
4-Once a text or corpus has been uploaded, Voyant moves into its ‘default skin,’ or primary editing environment.
5-Without clicking on any of the page elements, scan the page.
Let’s discuss!
- What do you immediately notice after uploading a text to Voyant?
- What stands out, or catches your attention?
- What types of information are contained in this page?
- What do you have questions about, or what is confusing and not immediately clear?
- Based on your initial scan, what function do you think these various components serve?
Editing in Voyant
6-In the default editing environment, Voyant displays five panels: Cirrus, Reader, Trends, Summary, and Contexts.
7-Each panel is a tool, and all the panel tools interact with each other. Modifying or interacting with one tool will update the others.

8-Each panel tool offers additional display and export options, which can be accessed by placing your cursor over the ? symbol in the top right of the tool’s box. From left to right:
- Export—opens a pop-up window with export and sharing options.
- Choose another tool—opens a dropdown with other tools that be displayed in the panel space.
- Options—opens a pop-up window with additional options for a specific tool.
- Additional information—provides a description of the tool’s functionality and possible uses.
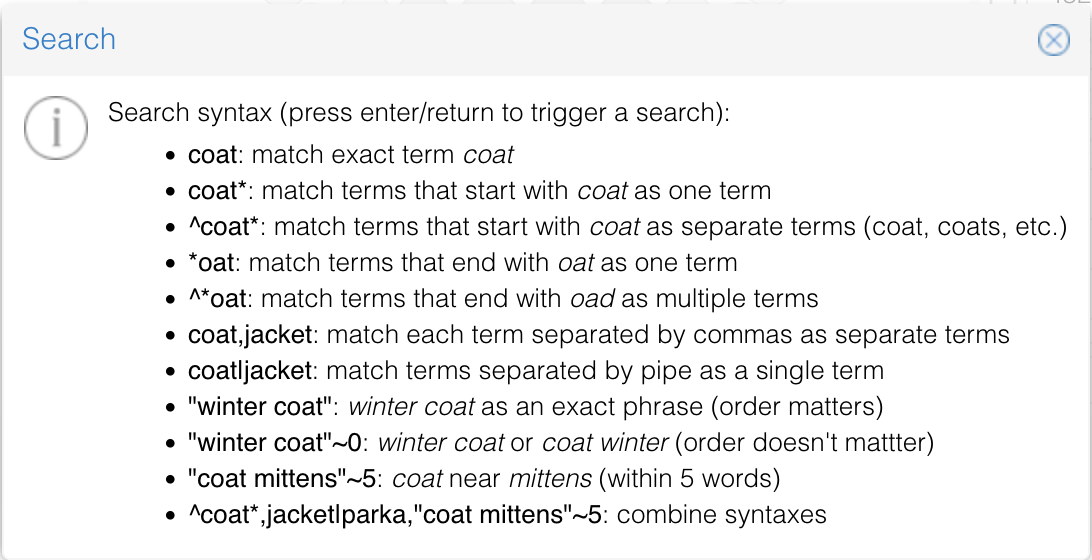
9-Most tool panels in Voyant also include a search bar, which allows you to search for particular terms. You can use Voyant’s search syntax to fine-tune your searching or cast a wider net. See the search syntax screenshot above for an overview.
Voyant’s Tools
Cirrus
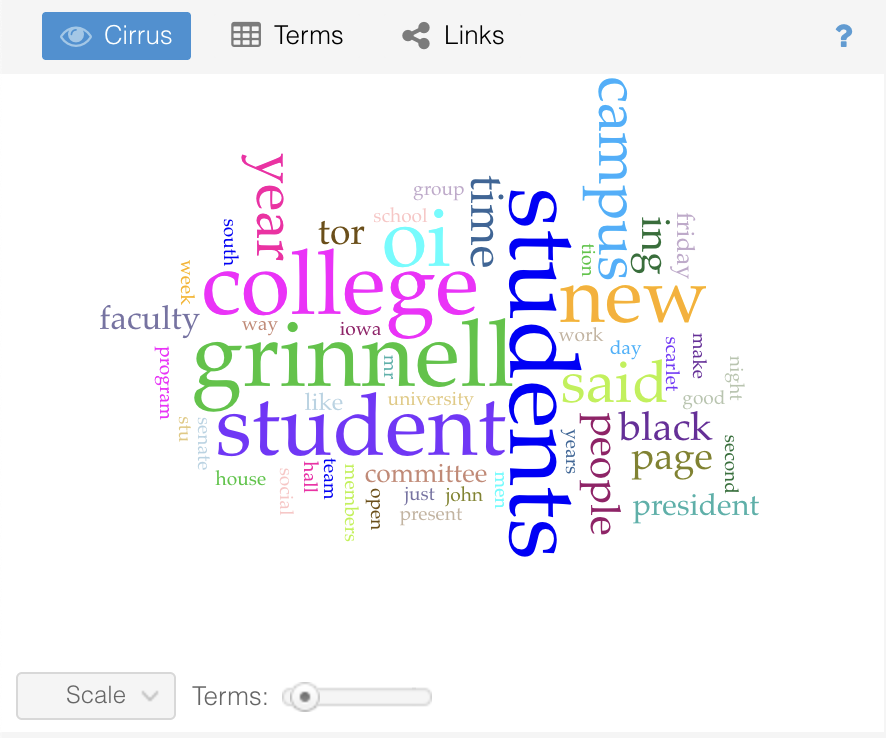
10-Cirrus (top left-hand corner of the page): Cirrus visualizes a word cloud of words contained in the uploaded text. Words that are larger in size and closer to the center of the visualization appear with greater frequency in the text.

11-The default Cirrus view displays a visualization of word count calculation. Clicking on the table icon labeled Terms switches from the word cloud to a table view of word counts and frequency trends.
12-The Links icon visualizes relationships between words by presenting a network visualization of connected terms, or words that appear in relation or proximity to each other.
Reader
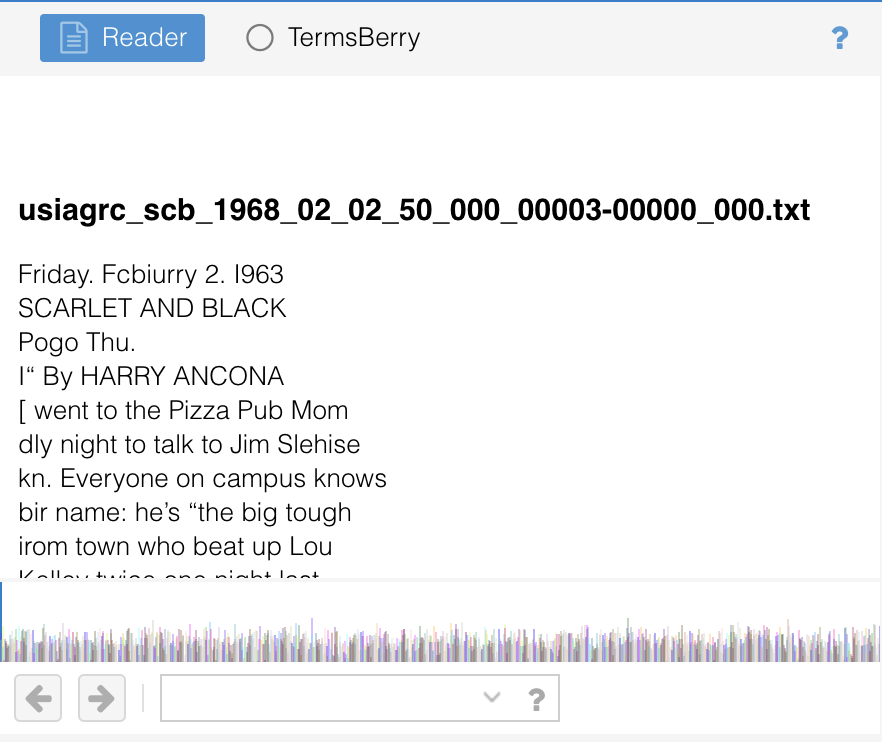
14-Reader (top middle of the page): Reader is a text reader that displays the original text. Moving the mouse over a word in the reader will highlight the word and display its frequency count.

15-Like with Cirrus, Reader offers additional panel views. Clicking on the circle icon labeled TermsBerry switches the panel to a visualization of term frequency and proximity. Hovering over a bubble with highlight the term and calculate the number of times it appears in the text.
Trends
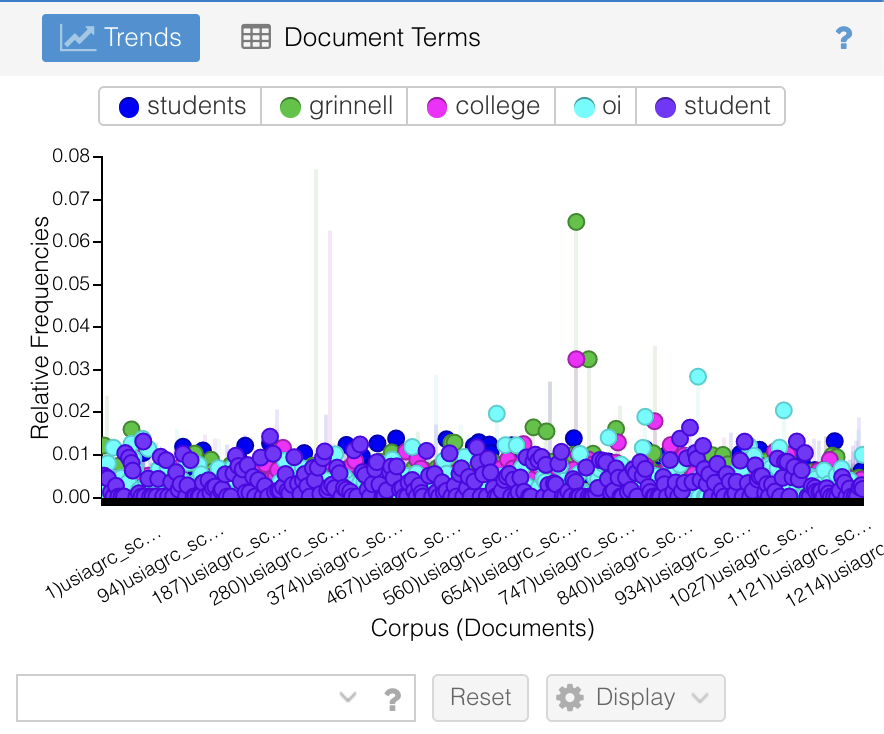
17-Trends uses a line graph visualization to show the distribution of terms and relative term frequency across the text. The legend will define the most frequently-appearing terms in the text, and the graph illustrates where and how frequently they appear in the text. Hovering over a graph point highlights a term, displays its relative frequency calculation, as well as the source text for that calculation.

18-Clicking on the table icon labeled Document Terms shows the frequency and proportion counts as a data table.
Summary

19-Summary provides information about the corpus, including the number of documents, words, and unique terms. Summary also calculates document length, vocabulary density, average words per sentence, and most frequently-occurring terms.
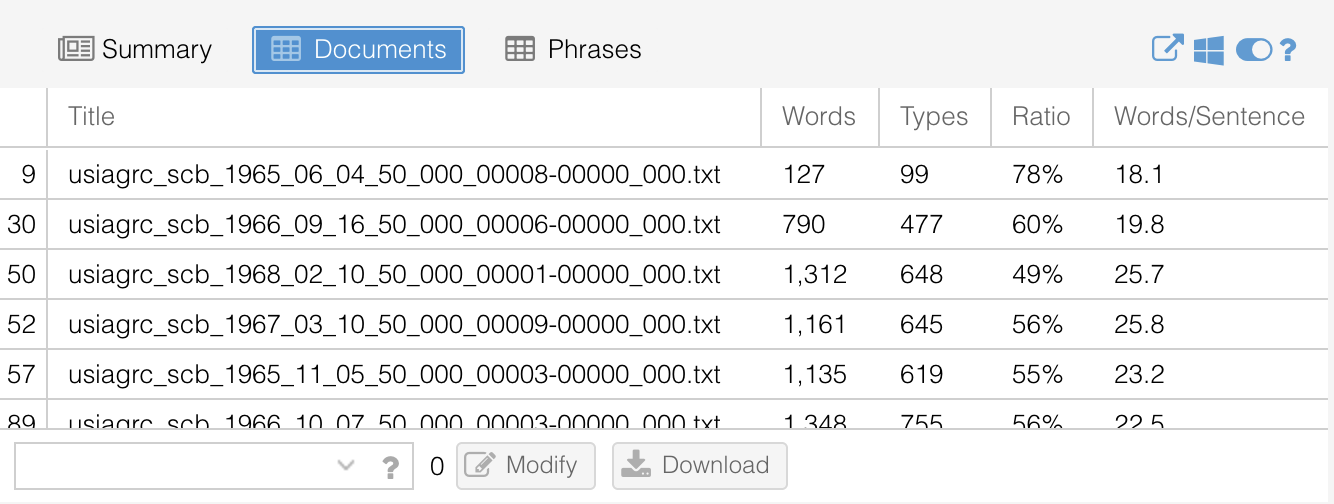
20-Clicking on the table icon labeled Documents shows the word count, unique term, word count ratio, and words per sentence calculated data in tabular form.

21-Clicking on the table icon labeled Phrases shows the number of times a particular phrase appears in the text, as well as the phrase length and document location.
Contexts

23-Contexts identifies the most frequently-occurring terms and shows the text that appears to the left and right of the term in the text.
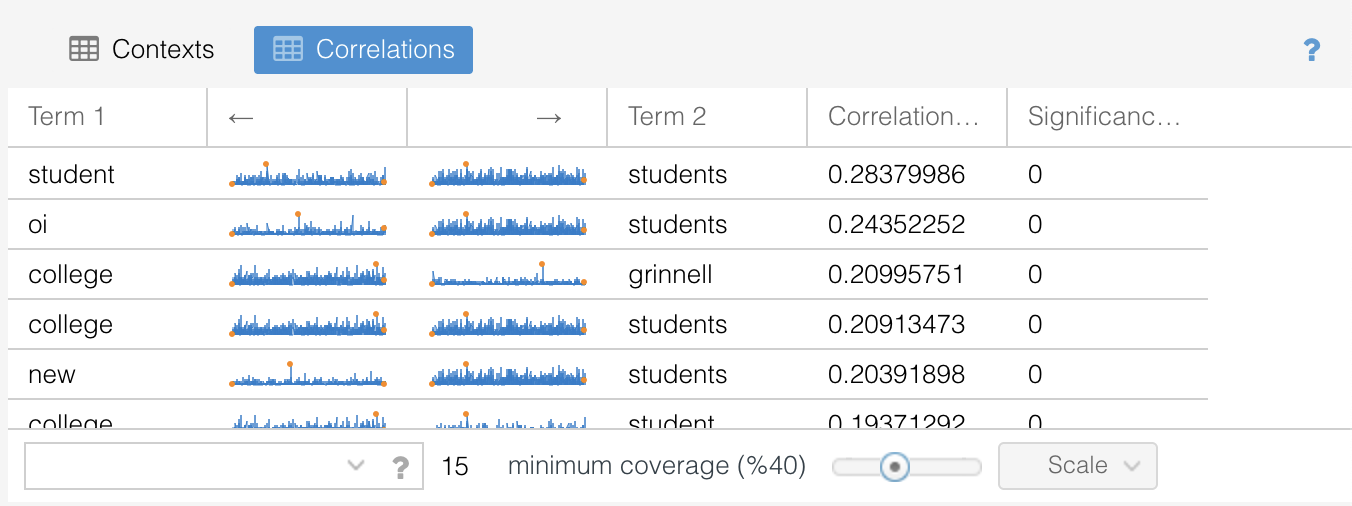
24-Clicking on the table icon labeled Correlations shows how frequently a specific term appear next to or near another term by calculating correlation and significance measures.
Interacting with Voyant Tools
26-Up to this point, we have been interacting with each panel tool individually. Now we will explore how the panel tools interact.
27-Select a panel tool, and click on a term, data point, or other interactive element within the panel tool. What changes in that panel after you click? What changes happen in the other panels? How does the analysis in each tool change based on how you interact with the data analysis and visualization?
28-Refresh the browser page, and select another panel tool. Use the search function to look for a term in the text. What changes in that panel after you search? What changes happen in the other panels? How does the analysis in each tool change based on how you interact with the search function?
29-What do you find useful about the interactive analysis and visualization tools? What do you find frustrating, unclear, or confusing? How does interacting with a tool change or impact your understanding of the text? What additional questions do you have about the text (or tool)?
Note: Voyant has some other tools and visualization options that this tutorial does not touch upon. You can explore them in the Tools section of Voyant’s documentation.
Exporting from Voyant
30-We briefly mentioned export options when introducing you to the editing interface. Voyant gives you the option to share an entire editing interface view. Move your cursor over the arrow-shaped export icon in the top-right hand corner of the page to explore this option.
31-Voyant also gives you the option to export or share the data or visualization created in a specific panel tool. Again, move your cursor over the arrow-shaped export icon in the top right-hand corner of a specific panel to explore this option.
Building Your Own Corpus
32-You can build your own corpus (dataset) for textual analysis and upload it to Voyant!
- Check out the Libraries Textual Data guide’s page on Data Sources for some suggestions and resources for finding textual data.
Final Reflection Questions
- What did you find engaging or interesting about Voyant Tools?
- What types of historical research questions could a researcher have about a text or collection of texts?
- How effectively might Voyant be able to address those questions?
- What challenges, frustrations, or limitations did you encounter while using Voyant?
- What remaining questions do you have about the S&B textual data?
- How would you move forward with Voyant as a tool for historical textual analysis?
Get Help
If you have questions, need help, get stuck, or want support trying something new, there are many support resources out there for you!
- Swing by Vivero drop-in peer mentoring hours: Vivero Digital Fellows trained in a variety of digital tools and approaches hold peer mentoring drop-in hours from 7-9 PM in the Burling Library Media Room (lower level) Sundays through Thursdays every week while classes are in session.
- Contact Libby Cave, Digital Humanities and Instruction Librarian via email at caveelizabeth@grinnell.edu
- Contact Tierney Steelberg, Digital Liberal Arts Specialist, via email at steelber@grinnell.edu
- Contact Liz Rodrigues, Humanities and Digital Scholarship Librarian, via email at rodrigue8@grinnell.edu [currently on leave]
- Make use of Voyant’s thorough documentation
