This tutorial was written by Tierney Steelberg, Digital Liberal Arts Specialist at Grinnell College’s DLAC (Digital Liberal Arts Collaborative).
 This work is licensed under a Creative Commons Attribution-NonCommercial-ShareAlike 4.0 International License.
Table of Contents
- What Is ArcGIS Online?
- ArcGIS Online Mapping: A Walkthrough
- Accessibility
- Sharing Your Maps
- Get Help
What Is ArcGIS Online?
ArcGIS Online is a cloud-based online mapping software that allows you to create complex digital maps for data analysis, as well as easily share them with others. Everyone at Grinnell has access to ArcGIS Online through the College. You can access your account by logging in with your Grinnell College credentials at https://grinnell.maps.arcgis.com/home/index.html. It is used in the browser, so you do not need to download anything special onto your computer.
ArcGIS Online can work with different types of spatial data: for this course, you will most likely be dealing with CSVs (delimited text file that stores tabular data – numbers and text – in plain text) or shapefiles (a file format for storing geographical location and attribute information data – made up of a grouping of individual files, compressed into a single .zip file). ArcGIS Online also has existing layers of data, such as census data, that you can pull into your mapping.
ArcGIS Online Mapping: A Walkthrough
FYI: Esri is in the process of releasing a new Map Viewer. For the purposes of this tutorial, we are using the older Classic Viewer, as the new viewer is still missing a few useful features (such as the ability to upload a CSV file directly to the map). Make sure you are using the Classic Map Viewer by clicking Open in Map Viewer Classic in the top right hand corner of the map page. (If it says Open in Map Viewer there, you’re already using the classic map viewer and are all set!)
Creating and Saving a Map
- After logging in, click Map in the top level menu of your ArcGIS Online homepage to create a new map.
- Customize the way your map looks by clicking the Basemap button in the top level menu of the map view, and then selecting your chosen basemap.
- Click the Save button on the top level menu of the map view, then click Save As to save a new map or a new copy of an existing map: you will be prompted to give your new map a title and tags.
- Click the Save button regularly as you work so your changes are saved.
- Return to an existing map by clicking Content from the homepage.

Uploading a Data File as a Layer
Download the sample data (Iowa public school 2019 enrollment) or use your own dataset (must be saved as a CSV file, with spatial information – addresses or latitude/longitude coordinates).
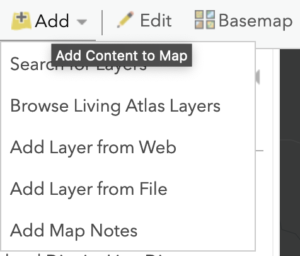
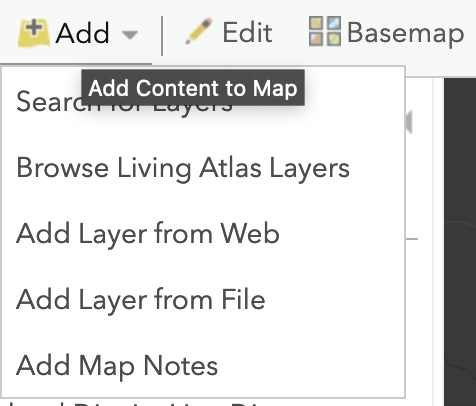
- Click the +Add button in the top-level menu and select Add Layer from File.
- Upload the CSV file.
- Click the Import Layer
- Match the Street_Address, City, and State field names to the Address or Place, City, and State location fields, respectively.
- Click the Add Layer button. You should now see the data as a layer (on the left).
- Underneath your layer, you can find buttons allowing you to pop out the legend, view the data as a table, and change the layer’s style. Under more options, you can do things like rename the layer or make a copy of it.

There are advanced analysis features (data joining, location finding, etc.) not available in the default ArcGIS Online account: they require a Publisher account role. If you need access to these, Tierney or another a campus ArcGIS administrator can change your role for you.
Customizing Layers
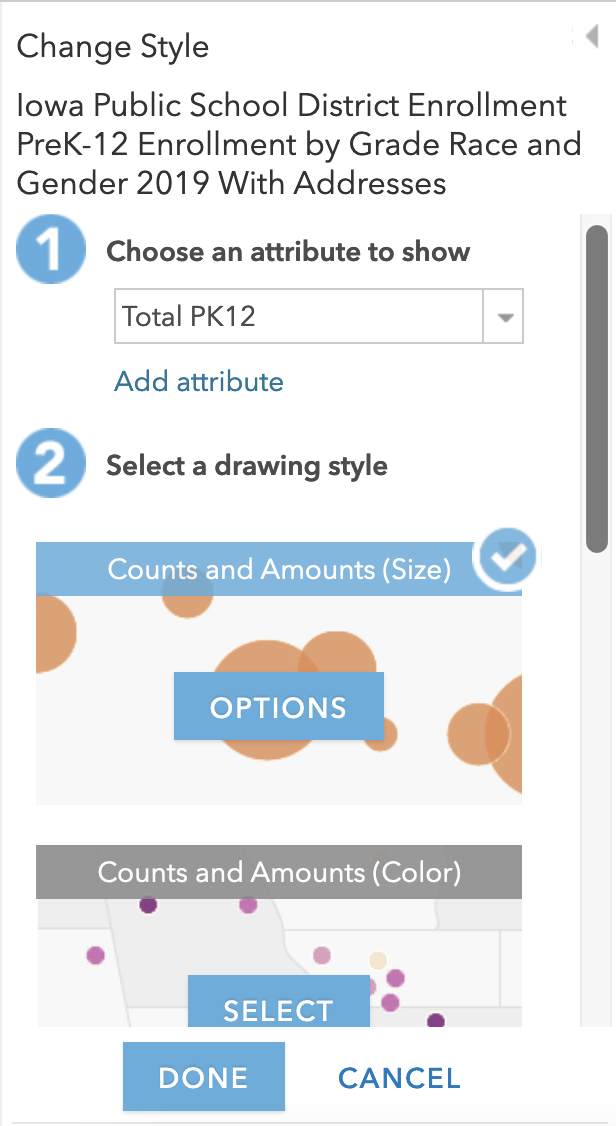
- Hover over your layer and click the Change Style
- Choose an attribute to show from the dropdown, then select a drawing style underneath (different options appear depending on whether the attribute is numeric or textual/categorical).
- You can also scroll down to the bottom and choose New expression to write a script to mathematically manipulate attributes in some way.
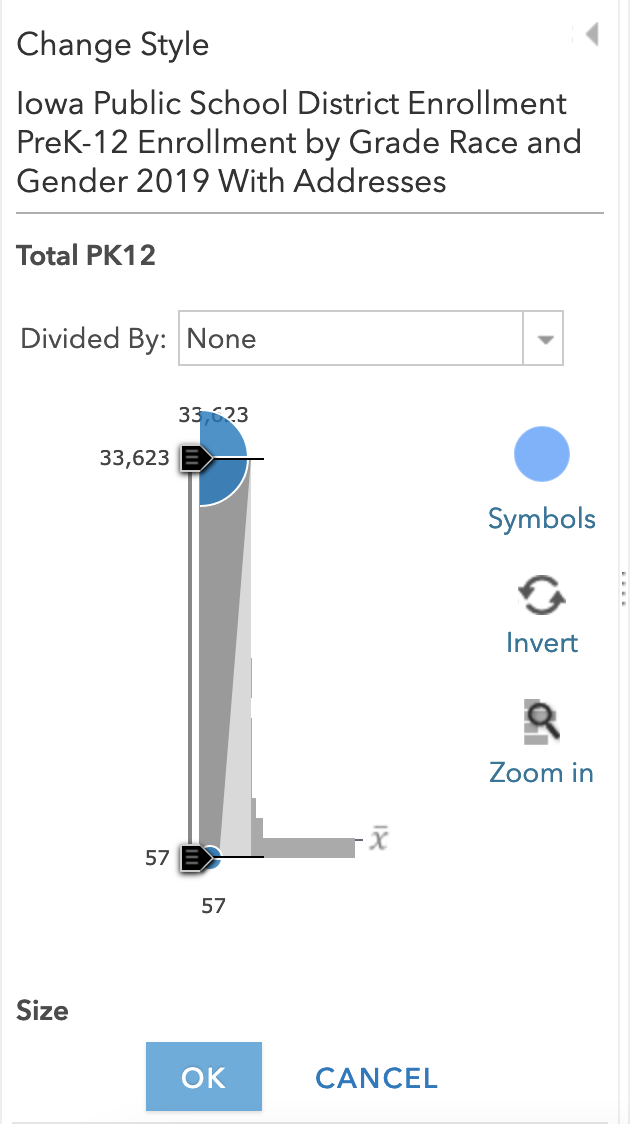
- Click the Options button at the center of the selected drawing style to customize the visualization on your map. Both visual aspects (like size, color, symbol, transparency) and some numeric/categorical aspects can be customized.
- You can use the Divided By dropdown to choose to divide a numeric attribute by another numeric attribute (for ex, to calculate a percentage).
- If certain conditions are met, you can map two attributes at once by clicking Add attribute.
- Once you’re finished, make sure to click the blue Done button at the bottom of the viewing pane to make sure your changes are saved.
Importing Existing Layers
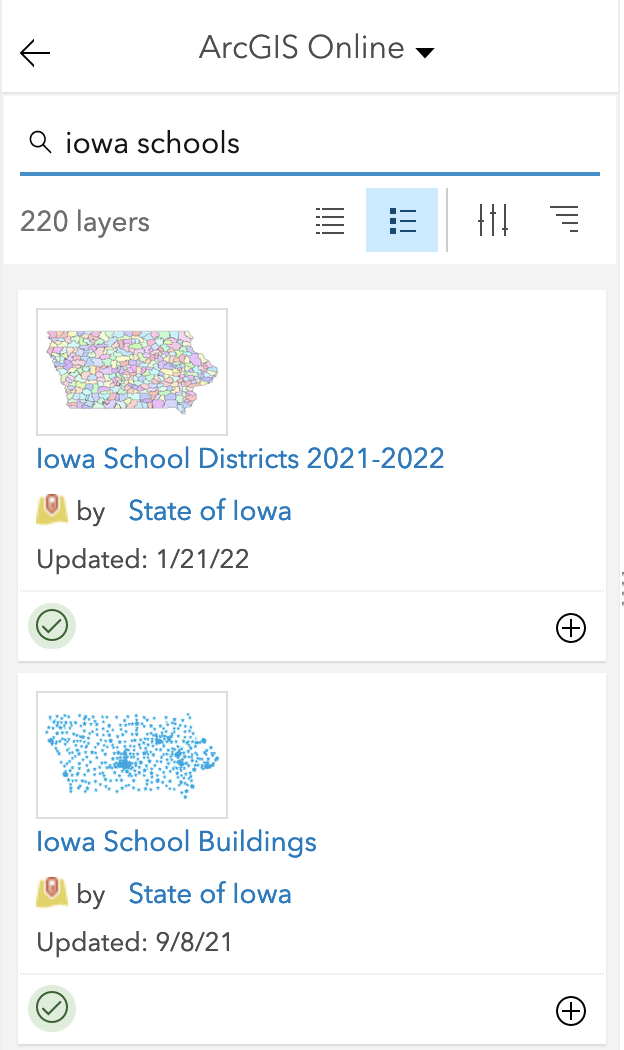
- Click the +Add button in the top-level menu and select Search for Layers.
- In the dropdown at the top, select ArcGIS Online.
- Search for an existing layer that could be relevant (such as school district boundaries from the state of Iowa).
- Click the plus button in the bottom right corner of a result to add it to your map.
- You can customize your imported layer using the same options as above.
Joining Layers
There are powerful analysis features that can be enabled on your ArcGIS Online account upon request: simply request a Publisher account from an ArcGIS Online admin (Tierney Steelberg or Gina Donovan) or put in a Help Desk ticket. The Publisher account also allows you to host feature layers that can be updated as needed and used across multiple maps.
Some examples of analysis features include:
- the ability to “join” one dataset to another using a unique identifier column
- the ability to measure distances between points (in a straight line or via selected travel mode)
- the ability to analyze patterns
- and more! See more on analysis from Esri’s help documentation: Perform Analysis.
The “join” feature is of particular interest for anyone who might want to combine their dataset with an existing dataset for a more nuanced analysis – for example, if you would like to connect education data by state, county, or district with additional data or with a polygon outline (rather than points data by address).
- First, make sure the two layers have a unique identifier in common (such as a county name, a district name, a state name), and make sure they are both added to your map.
- If you want, you can play around with this using data from the state of Iowa: add the Iowa School Districts 2022-2023 layer from ArcGIS Online using the method outlined above, then add this 2022-23IowaPublicSchoolDistrictEnrollments CSV file as a table (no location information).
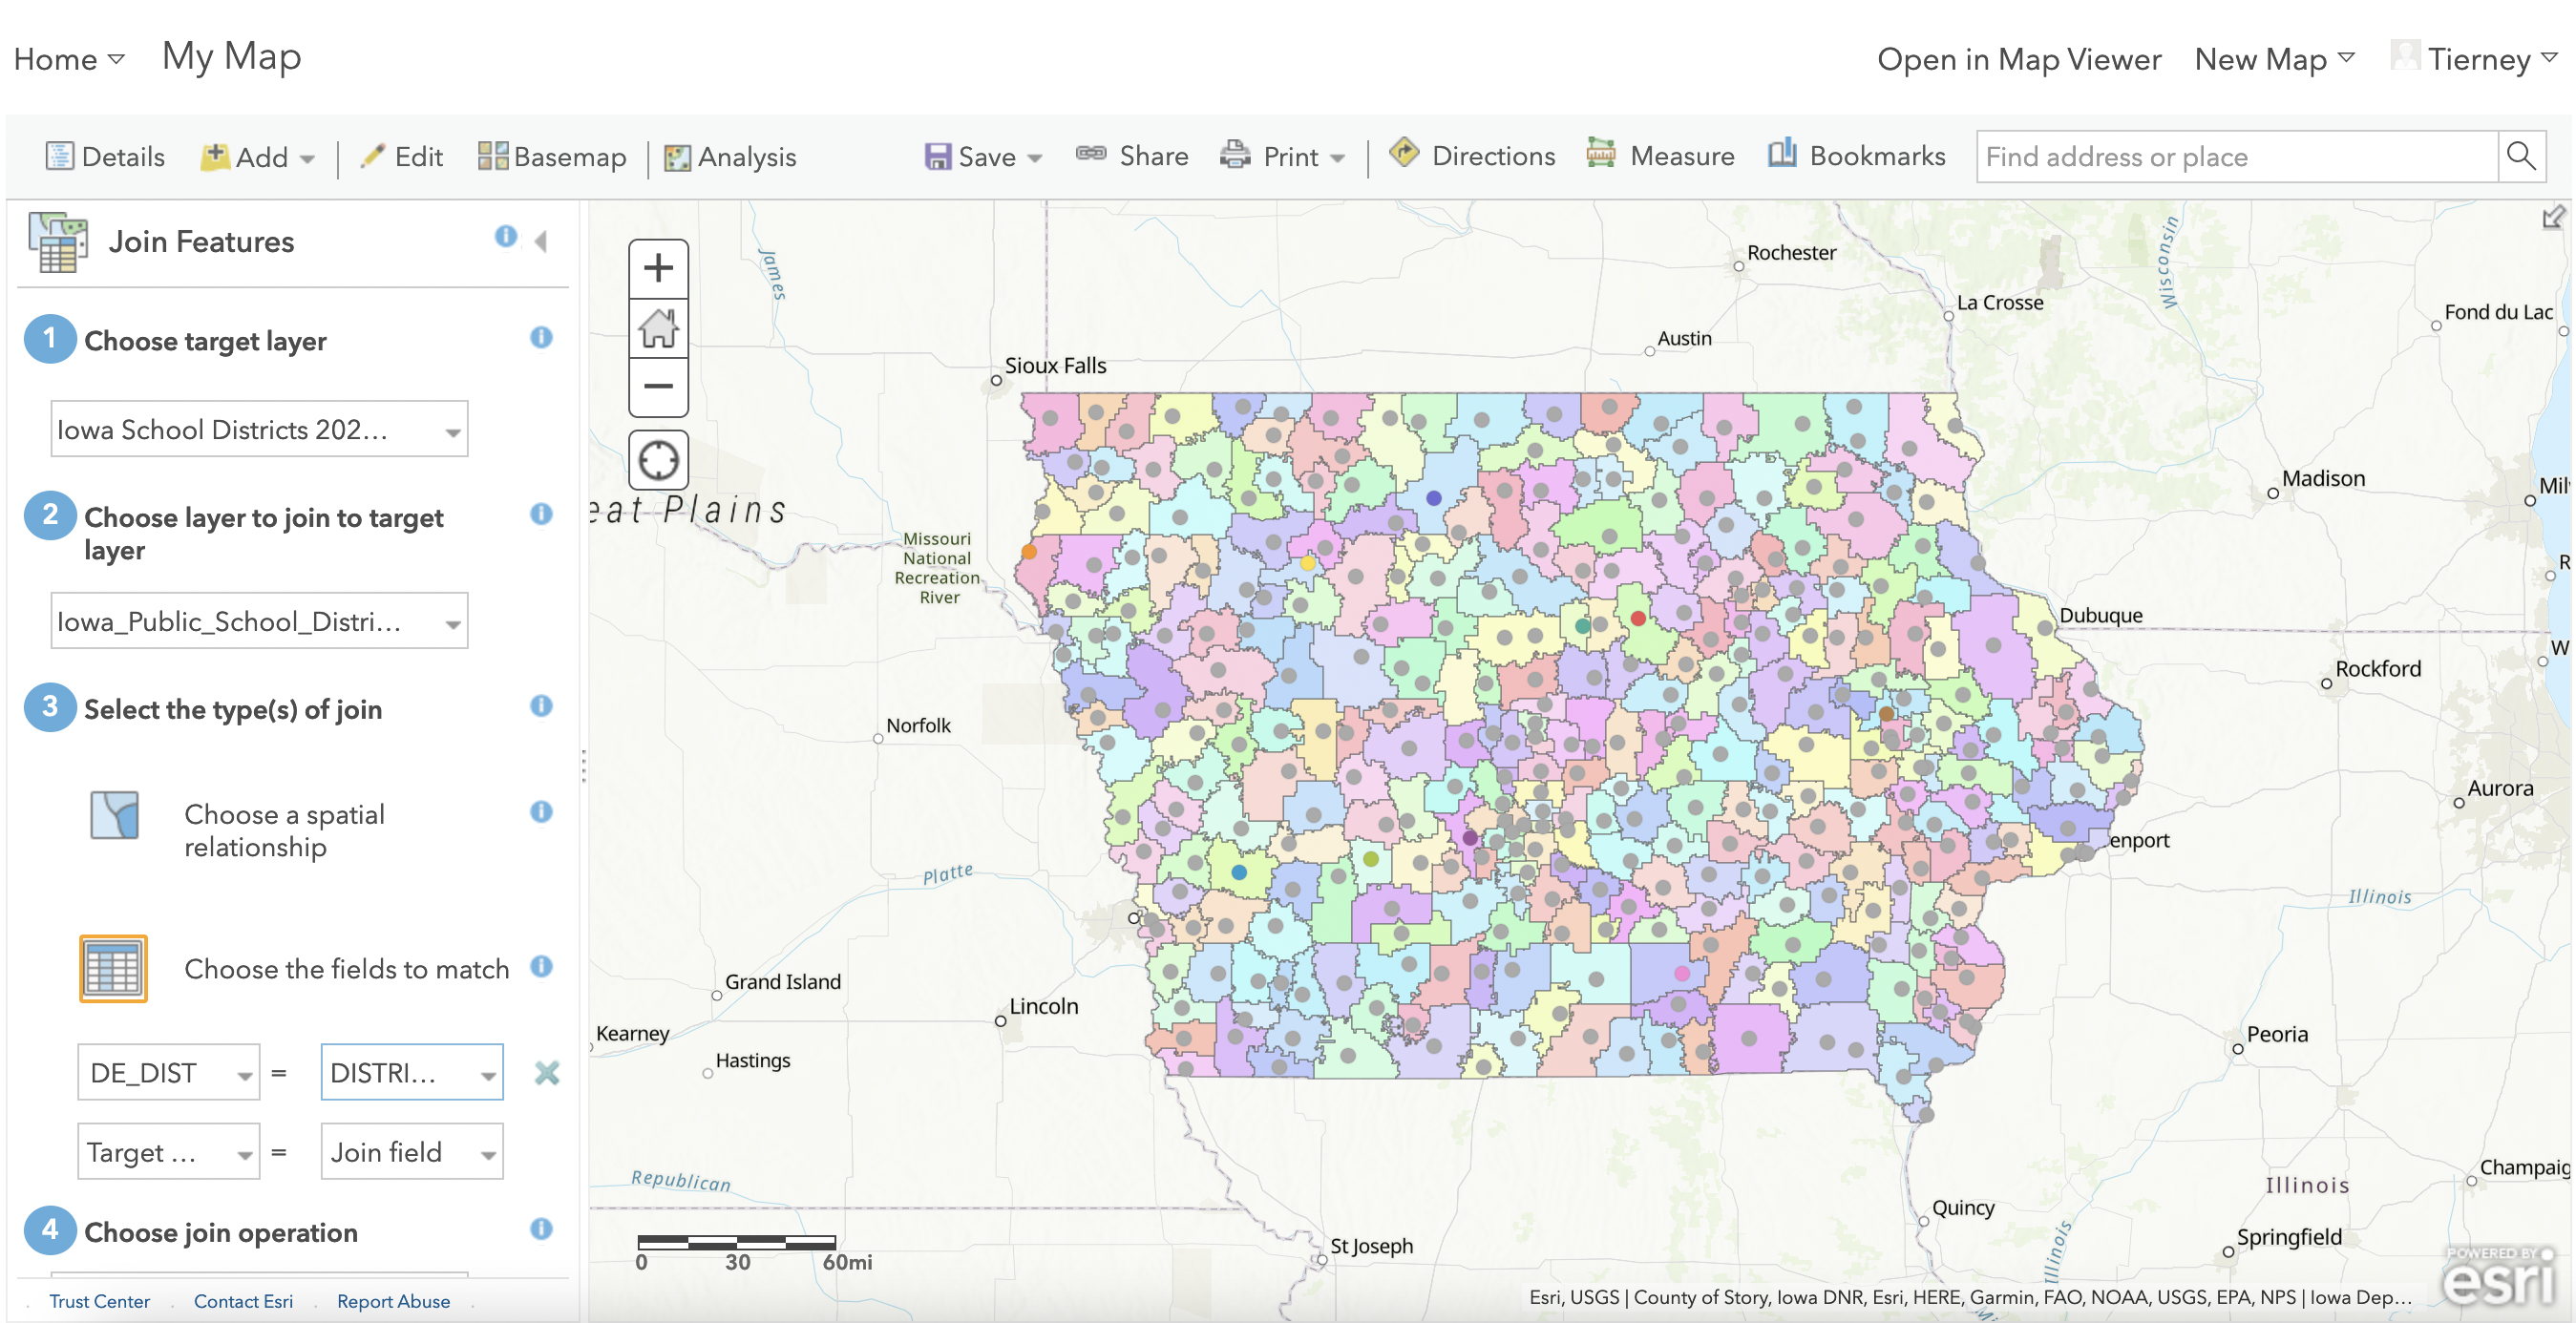
- Click the Analysis button in the top-level map menu.
- Under Summariza Data select Join Features. A menu of options will appear.
- Choose the target layer (the one whose spatial features will remain on the map) and the join layer (whose dataset information fields will be added to the target layer).
- With the practice dataset, the target layer is the Iowa School Districts layer, and the join layer is the table of enrollment data.
- Under type of join, select Choose the fields to match and then choose the two ID fields to match – please note they must be identical.
- With the practice dataset, you can match DE_DIST with District Number.
- Choose your join operation: for most joins, this will probably be a one-to-one (i.e., you are joining a spreadsheet of district-level data with a map by district, so you will be joining a single line from each dataset with one another, without any extras).
- Give your result layer a unique name.
- Click the Run Analysis button at the bottom.
- The analysis will take a couple minutes to run. Once it has run, the new layer will be added to your map, and you can customize it as you would any other layer. If there are any errors, you can try to run the analysis again, tweaking as needed.
See a walkthrough from Esri of Join Features in ArcGIS Online’s Map Viewer Classic.
Customizing Pop-Ups
You can configure the pop-ups that appear when you click on your data points.
- Hover over the layer you’re working with and click the More Options button, then the Configure Pop-Up
- At the top of the pane, you can select a pop-up title based on an attribute.
- In the Display dropdown below, you can decide if you want to display:
- a list of attributes (which you can customize below using the Configure Attributes – you can choose which ones you want to appear)
- a description from one field
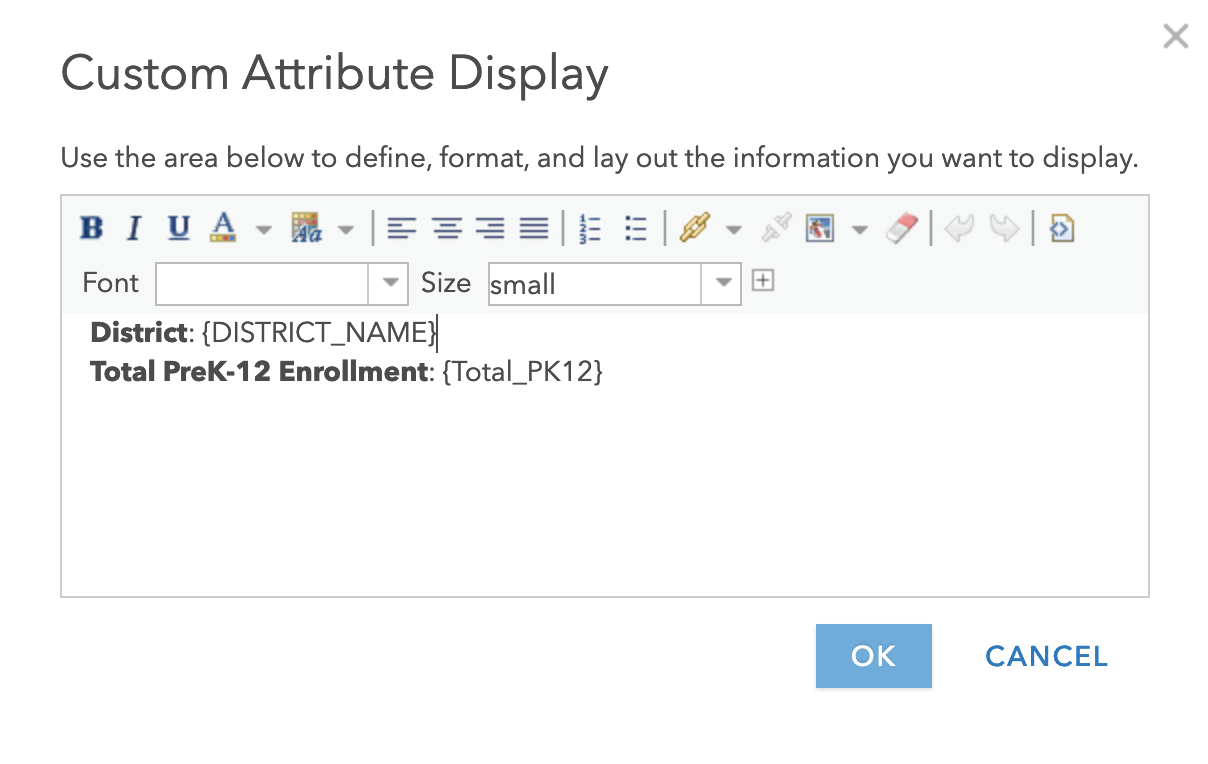
- a custom attribute display
- no attribute information
- When you’re done, click the OK button at the bottom to save your changes.
Accessibility
As you create maps, keep the following in mind:
- ensure appropriate color contrasts and differentiation (basemap, layer colors…)
- consider how you can avoid using color alone to convey meaning: vary labels and color, utilize different shapes, change both size and color value of the same shape (source: “Improving Accessibility with ArcGIS Online Web Mapping Apps” presentation from Esri)
- be thoughtful about your text content (pop-ups, map descriptions, and more): break up walls of text, ensure appropriate typeface and font size when you are customizing, provide links that make sense out of context (i.e., no “click here”)
Sharing Your Maps
You can see options for sharing your map when you click the Share button in the top level menu of the map view. Select your sharing setting (choose Everyone (public) or Grinnell College), then copy and paste the link to your map. If you want to include your map as an image somewhere, you can use the top-level Print button.
There are other options from Esri for displaying and sharing your maps, that allow you to add additional context or narrative as well:
- StoryMaps allow you to build a digital narrative that can seamlessly pull in and contextualize your map, with the addition of text, images, and other media
- Web apps allow you to create an app from your map that provides increased functionality and interactivity for your viewer (comparison, time slider, bring in charts or images, and much more)
Get Help
Resources:
- ArcGIS Online mapping resources
- Get Started with ArcGIS Online
- Create Maps
- Learn ArcGIS Hub
- Publisher Role functionality
- StoryMaps resources
- Getting Started with ArcGIS StoryMaps
- Logging into StoryMaps by Gina Donovan
- Sharing a StoryMap by Gina Donovan
Get help with…
- Finding data: Julia Bauder, Director of DASIL & Social Studies and Data Services Librarian
- ArcGIS Online mapping: Tierney Steelberg, Digital Liberal Arts Specialist; Vivero peer mentors (Burling Library lower level Media Room, Sun through Thurs, 7-9 PM)
- ArcGIS Pro mapping: DASIL peer mentors
- StoryMaps: Gina Donovan, Senior Instructional Technologist; Vivero peer mentors (Burling Library lower level Media Room, Sun through Thurs, 7-9 PM
